
Complete Guide to Personality-Powered Team Analysis
Every group has invisible dynamics — communication patterns, trust signals, blind spots, and complementary strengths that shape how people work together. The Torai team dashboard makes those dynamics visible, measurable, and coachable.
Why Personality Analysis Changes How Groups Work Together
Most groups do not struggle because of incompetence. They struggle because people misread each other. A direct communicator sounds aggressive to someone who needs warmth before feedback. A careful thinker looks indecisive to someone who values speed. A big-picture person appears careless to someone who lives in detail. These are not personality flaws — they are style differences. And when they go unnamed, they become friction, resentment, and lost performance.
Research on psychological safety consistently shows that teams perform better when members feel understood rather than judged. ✓ The Torai team dashboard was built on this principle. It takes each member's validated personality profile — mapped across eight archetypes and seven capability dimensions — and turns it into a set of visual, interactive tools that any group leader, coach, facilitator, or member can use to understand what is actually happening inside their team.
This guide walks through every view in the dashboard: what it shows, how to read it, and what to do with the insights it surfaces.
Who Uses Torai — and Why It Works for Any Group
Torai is not limited to corporate team building. It is designed for any group of two or more people where relationship dynamics, communication, and collaboration matter. That includes workplace teams and departments, cross-functional project groups, startup co-founders and leadership teams, sports teams and coaching staffs, couples and families, nonprofit boards and community organizations, faith communities and ministry teams, academic research groups and student cohorts, volunteer organizations, and advisory boards.
The common thread is this: whenever people need to coordinate, make decisions together, navigate conflict, or simply understand each other better, personality awareness creates an advantage. The Torai dashboard gives any group a shared, visual language for differences that would otherwise remain invisible — or worse, become sources of blame and misunderstanding. ✓
Privacy by design
Torai is built on a PII-protective architecture. No real names are displayed inside the platform — only team aliases chosen by each member. Personality data is stored separately from identity data, and the AI coaching system never has access to personal identifiers. This makes it safe for sensitive group contexts where privacy matters.
Team Panorama: Your Team at a Glance
Team Panorama is the first view you see when you open the Torai team dashboard. It is designed to give leaders and coaches a high-level snapshot of the entire group's personality composition — what the team is collectively strong at, where the gaps are, and how diverse or concentrated the group's thinking styles are.
Team Health Metrics
At the top of the Panorama view, five metrics summarize the team's current state across key dimensions.
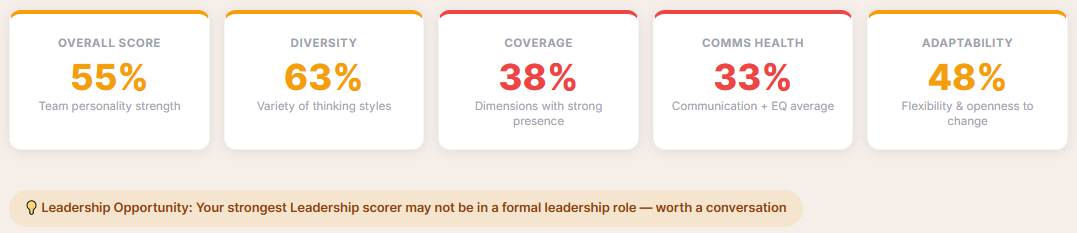
- Overall Score represents the team's collective personality strength — how well the group's profiles translate into team-level capability.
- Diversity measures the variety of thinking styles present. Higher diversity means more cognitive range, which research links to stronger problem-solving and innovation in teams. ✓
- Coverage measures how many of the eight personality dimensions are represented above a minimum threshold. Low coverage means the team has collective blind spots — entire ways of thinking that no member naturally brings to the table.
- Comms Health reflects the team's combined communication and emotional intelligence sub-category scores. Teams with low communication health often experience more misunderstanding, unproductive conflict, and meeting fatigue.
- Adaptability measures the team's collective flexibility and openness to change — critical during transitions, restructuring, or fast-moving projects.
The dashboard also surfaces leadership opportunity alerts when the data reveals structural patterns worth paying attention to — for example, when a team's strongest leadership score belongs to someone who is not in a formal leadership role.
Team DNA
The Team DNA bar is a stacked horizontal visualization showing how the team's dominant personality types are distributed across all eight archetypes: Achiever, Creator, Explorer, Guardian, Harmonizer, Nurturer, Strategist, and Visionary.
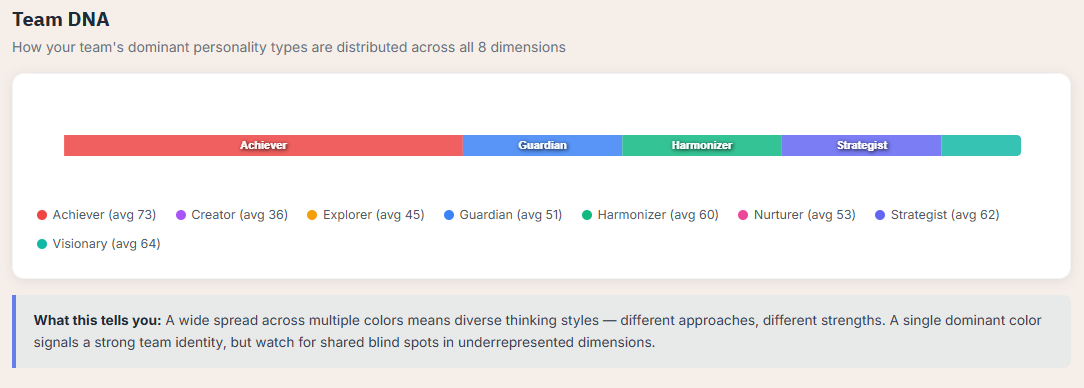
How to read it: A wide spread across multiple colors means diverse thinking styles — different approaches, different strengths. A single dominant color signals a strong team identity, but also potential blind spots in underrepresented dimensions. Neither is inherently better; both are worth understanding.
Team Coverage Radar and Coverage Analysis
The Coverage Radar plots the team's average score across all eight personality dimensions on a radar chart, compared against a strength threshold line (typically 60 points). Dimensions that fall below the threshold represent areas where the team has limited natural coverage — these are not failures, but they are conversation starters.
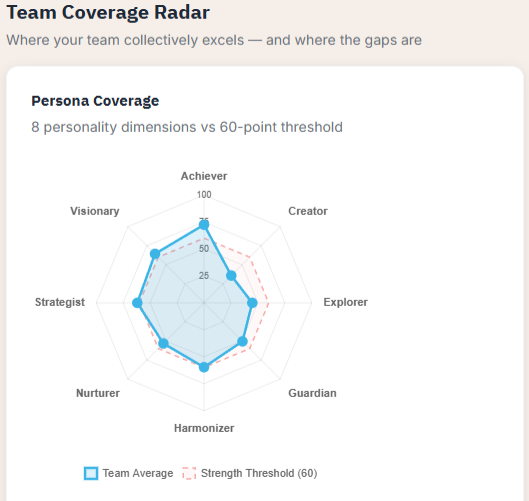
The accompanying Coverage Analysis list ranks each dimension by the team's average score and highlights which ones fall below the threshold. This makes it easy to see at a glance whether the team has natural coverage in areas like Creator (innovation), Guardian (stability), or Explorer (curiosity and adaptability).
Why coverage matters
Research on team composition shows that groups with gaps in specific cognitive or personality dimensions tend to develop predictable failure patterns in those areas. A team with no natural Guardian presence, for example, may consistently undervalue risk management and process stability. A team with no Explorer presence may resist change even when the environment demands it. Coverage analysis makes these structural risks visible before they become performance problems. ✓
Sub-Category Coverage
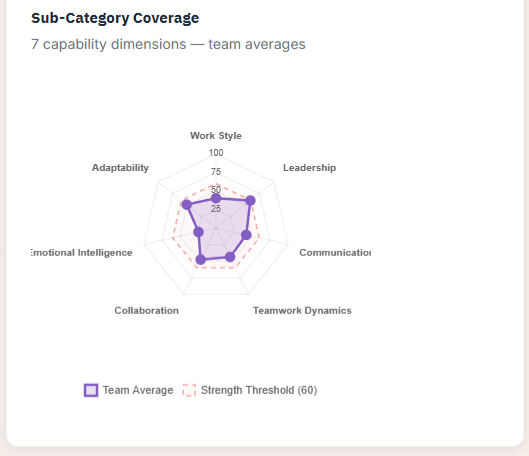
Below the persona-level radar, a second radar chart shows coverage across the seven capability sub-categories: Work Style, Leadership, Communication, Teamwork Dynamics, Collaboration, Emotional Intelligence, and Adaptability. These sub-categories cut across personality types and reveal how the team's traits translate into real-world skills.
Team Fingerprints
Team Fingerprints displays a compact radar card for every member of the team. Each card shows the individual's personality signature across all eight dimensions, along with their alias and dominant archetype.
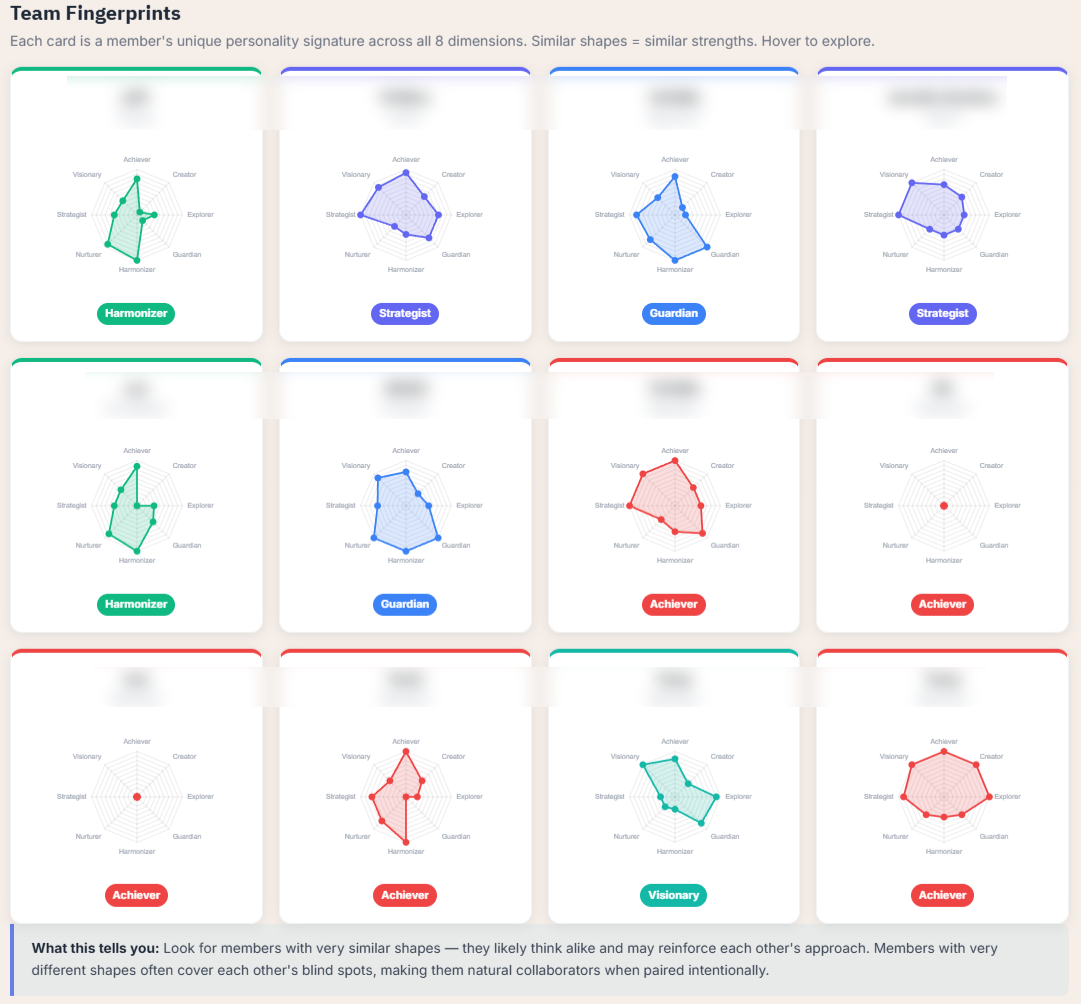
How to use it: Look for members with very similar shapes — they likely think alike and may reinforce each other's approach. Members with very different shapes often cover each other's blind spots, making them natural collaborators when paired intentionally. This is where complementarity becomes visible at a glance.
Strengths and Development Areas
The Strengths and Development Areas heatmap is one of the most actionable tools in the Panorama view. It displays every team member's score across all seven capability sub-categories in a color-coded matrix: green for strength, amber for moderate, and red for development area.
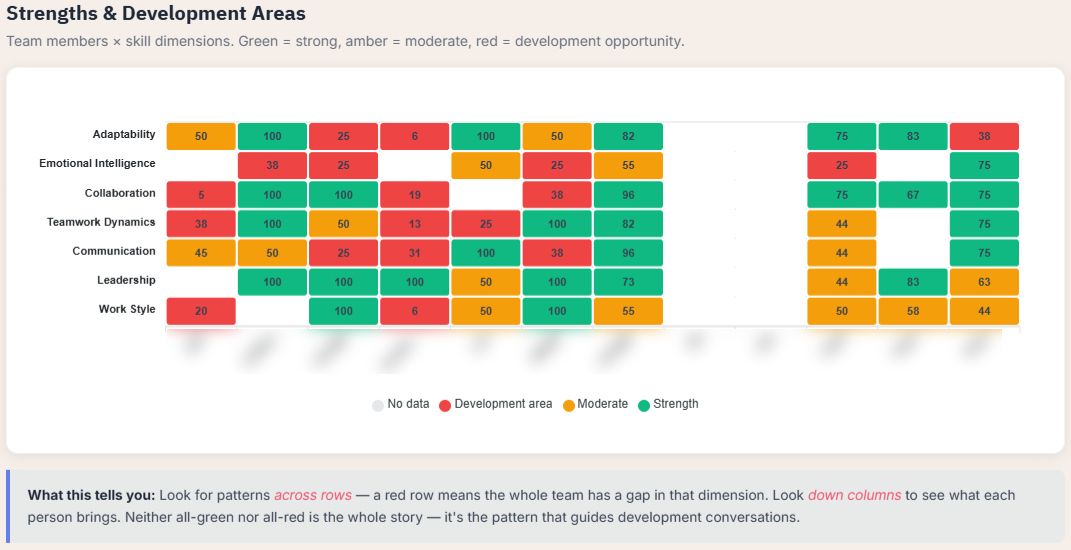
How to read it: Look for patterns across rows — a red row means the entire team has a gap in that dimension. Look down columns to see what each person brings. Neither all-green nor all-red is the whole story; the pattern is what guides development conversations.
Suggested coaching conversations
Throughout the dashboard, Torai generates context-aware coaching prompts based on the data visible in each section. These prompts are designed to be used directly with the AI Coach — you can copy them, edit them, or use them as a starting point for a deeper team conversation. The AI Coach has full context on your team's composition and can provide specific, personality-informed guidance.
See your team's panorama
Map your group's personality composition and discover where you are strong, where the gaps are, and where coaching can make the biggest difference.
Start with ToraiCompare Members: See Where People Overlap and Diverge
The Compare Members view is designed for side-by-side personality analysis. Select two or three team members and the dashboard immediately visualizes where their profiles align and where they differ — across both the eight personality archetypes and the seven capability sub-categories.
This view is essential for pairing partners on projects, understanding the roots of interpersonal friction, designing mentoring relationships, or simply helping two people see each other more clearly. ✓
Member Selection and Similarity Scores
At the top, you select members from dropdown menus. Immediately, the dashboard calculates pairwise similarity scores — displayed as percentage pills that categorize each pair as having moderate overlap, contrasting styles, or high similarity.
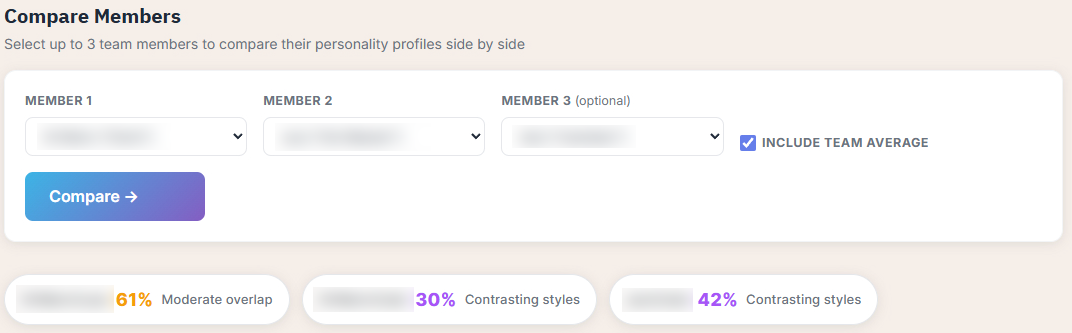
What the scores mean: A high similarity score means two people naturally approach problems, communication, and decisions in similar ways. A low score means contrasting styles — which is not a problem to solve, but a dynamic to understand and leverage. You can also toggle the team average overlay to see how the selected members compare against the group norm.
Personality Overlay
The Personality Overlay is a multi-layer radar chart that plots each selected member's scores across all eight personality dimensions on the same canvas. Where the shapes overlap, members think alike. Where they diverge, there is potential for complementarity — or creative tension worth exploring.
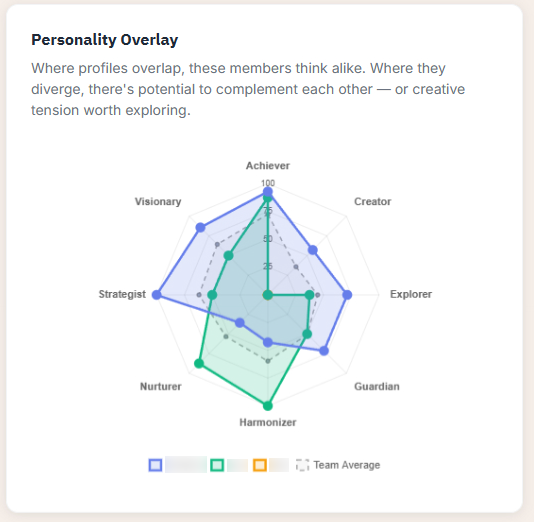
A dotted line shows the team average for reference, making it easy to see whether the selected members skew in the same direction relative to the group or pull in opposite directions.
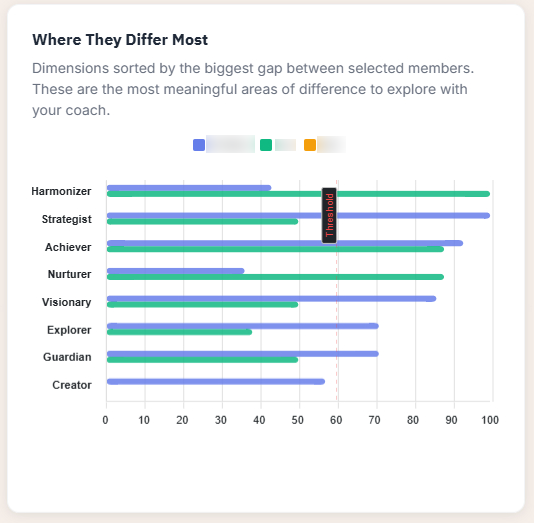
Where They Differ Most
This horizontal bar chart ranks the eight personality dimensions by the size of the gap between the selected members. The dimensions with the biggest differences appear at the top — these are the areas most likely to produce both friction and creative value.
Why differences are valuable
Research on team cognitive diversity shows that complementary pairs — people who think differently — often produce better outcomes than similar pairs, provided they have the communication skills and mutual understanding to work through the friction that difference creates. The Compare view is designed to make that friction legible and coachable rather than personal and destructive. ✓
Sub-Category Comparison
The grouped bar chart at the bottom of the Compare view plots each selected member's score across all seven capability sub-categories — Work Style, Leadership, Communication, Teamwork Dynamics, Collaboration, Emotional Intelligence, and Adaptability — side by side, with the team average shown in gray for context.
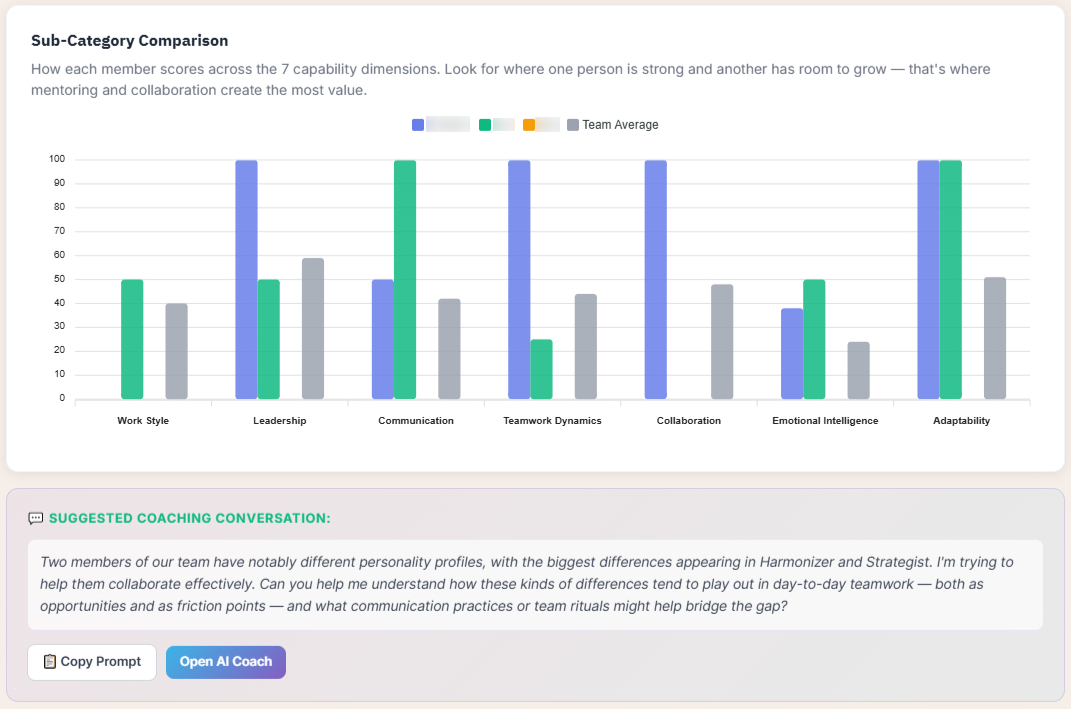
How to use it: Look for sub-categories where one member is strong and another is in a development area. These are natural mentoring opportunities — one person can coach the other in a specific capability, and the reverse may be true in a different dimension. This is how teams turn personality differences into structured development.
Team Map: Complementarity and Relationship Patterns
The Team Map view shifts the focus from individual profiles to relationships between members. It answers two fundamental questions: how similar or different is every pair on the team, and where do clusters, outliers, and natural tensions appear when you plot the group on any two personality dimensions?
Complementarity Matrix
The Complementarity Matrix is a color-coded grid showing how different each pair of team members is across all eight personality dimensions. Darker green means more complementary — these pairs naturally cover each other's blind spots. Lighter colors indicate more similarity — these pairs may work seamlessly but could benefit from a contrasting perspective.
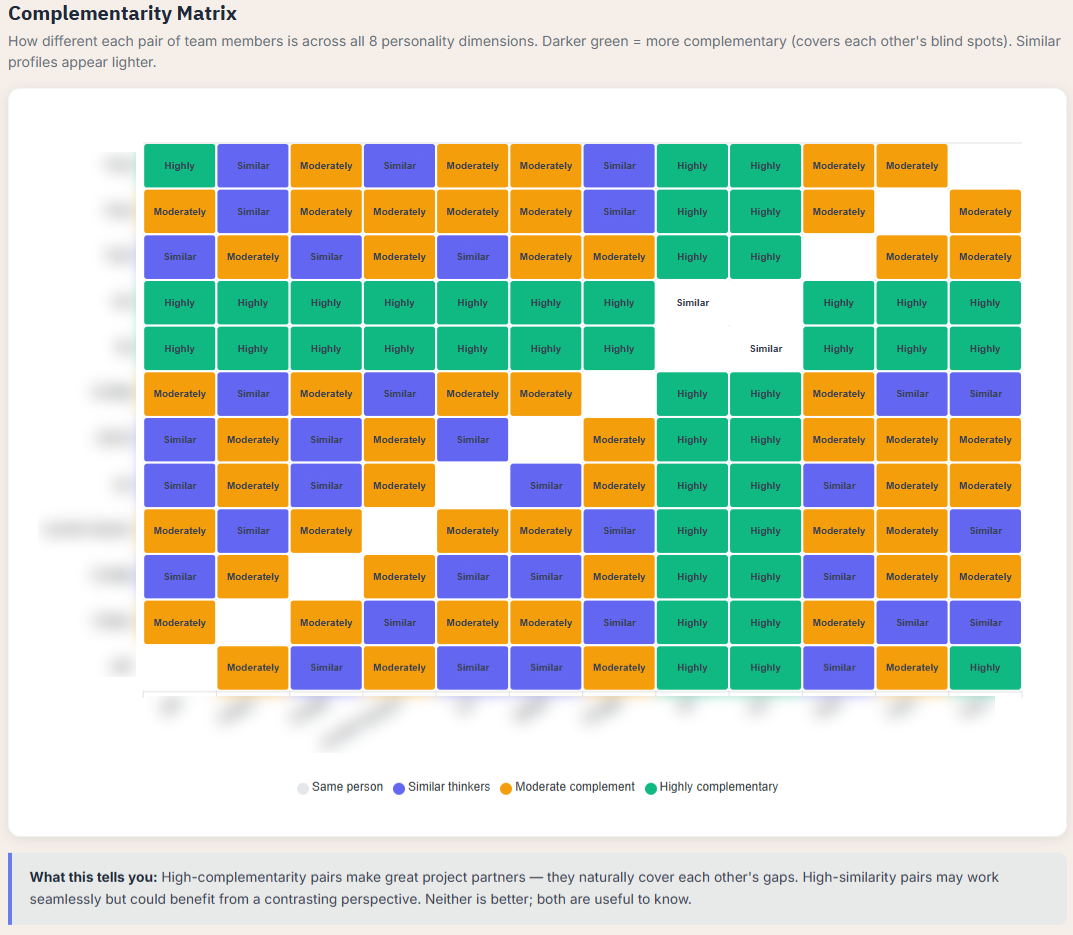
How to read it: High-complementarity pairs (dark green, labeled "Highly") make strong project partners because they naturally cover each other's gaps. High-similarity pairs (lighter, labeled "Similar") may work smoothly but risk groupthink on shared blind spots. Neither is better; both are useful to know. Look for rows or columns that are mostly one color — that person is either a natural bridge or a natural outlier on the team.
The matrix makes team structure decisions more intentional. Instead of assigning partners based on who gets along, leaders can pair people based on who covers each other's blind spots — and then use the AI Coach to help those pairs navigate the communication challenges that complementarity sometimes creates. ✓
Personality Quadrant Explorer
The Quadrant Explorer is a two-dimensional scatter plot that lets you choose any two personality dimensions as the X and Y axes and see where every team member falls. Each dot is color-coded by the member's dominant archetype.
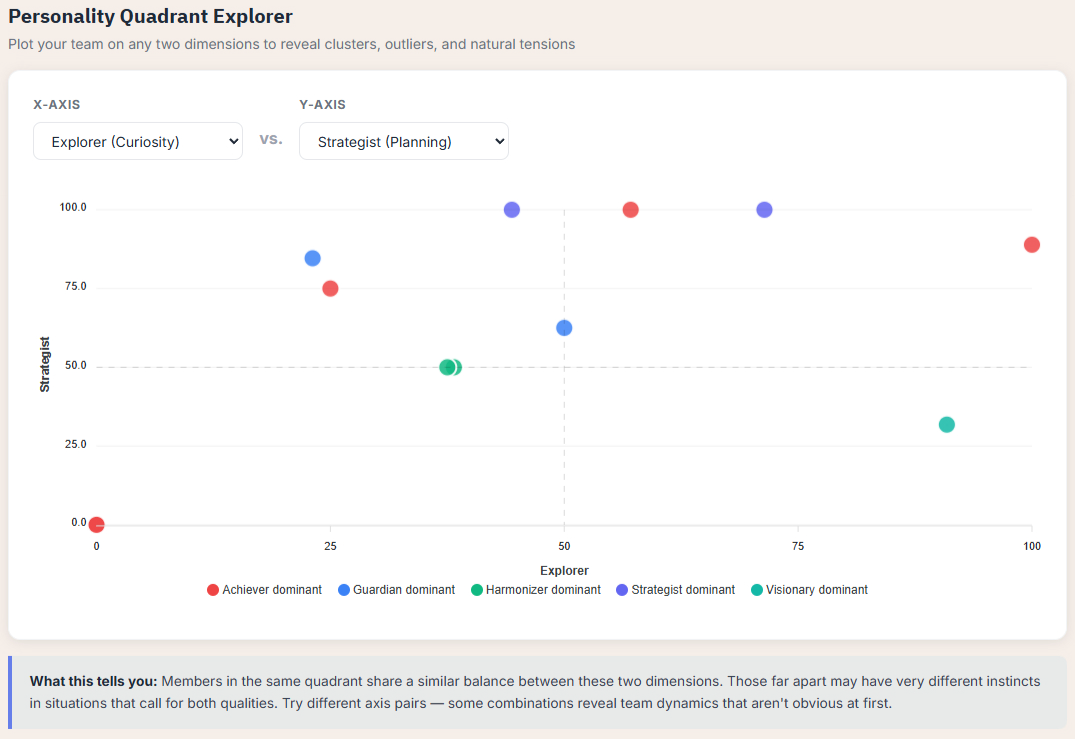
This tool reveals patterns that are invisible in one-dimensional views. Members in the same quadrant share a similar balance between those two dimensions. Members in opposite quadrants may have very different instincts in situations that call for both qualities. Members clustered together may form natural subgroups. Members isolated from the cluster may experience the team differently than others.
Try different axis combinations
The Quadrant Explorer is most powerful when you explore multiple axis combinations. Plotting Explorer (Curiosity) against Strategist (Planning) reveals different dynamics than plotting Harmonizer against Achiever. Some combinations reveal hidden tensions that never surface in day-to-day work but explain long-standing patterns. The AI Coach can suggest axis pairs based on your team's composition.
Map your group's dynamics
See who complements whom, where the clusters form, and what axis combinations reveal about your team's hidden structure.
Try Torai for teamsGo Deeper: Individual Spotlights and Capability Analysis
The Go Deeper view is where team-level patterns become individual-level coaching conversations. It lets you spotlight any single member and see exactly how they compare to the team average — across both the eight personality archetypes and the seven capability sub-categories.
Member Spotlight
Select any team member and immediately see two visualizations side by side. The radar chart on the left shows their personality profile across all eight dimensions, overlaid against the team average. The horizontal bar chart on the right ranks their seven capability sub-category scores — sorted from strongest to weakest — against the team average for each.
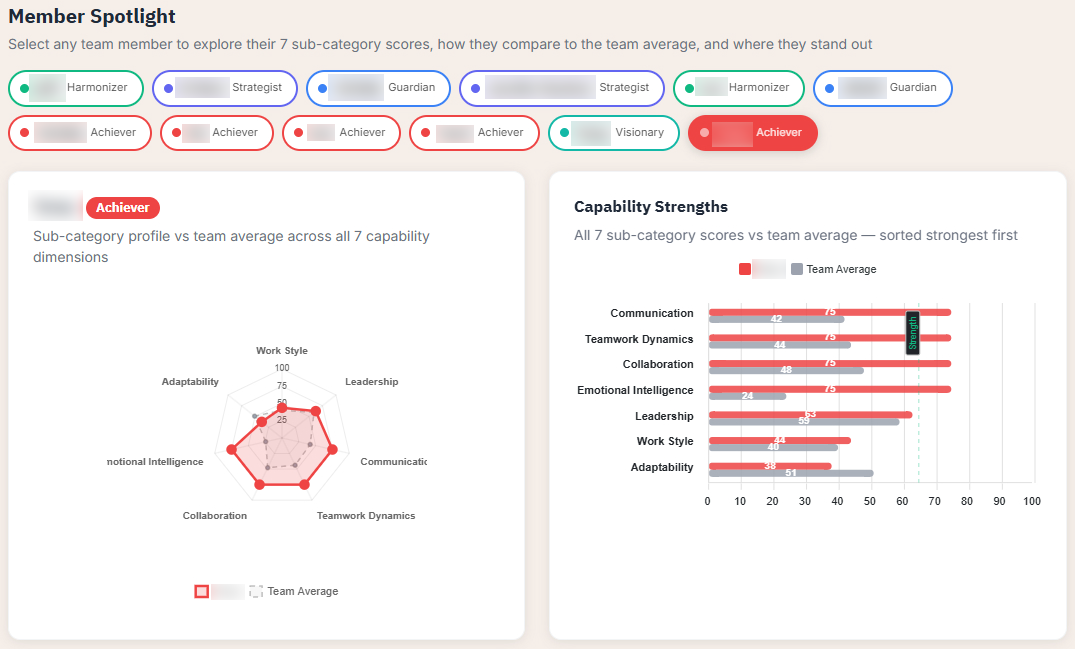
What to look for: Where the individual's radar shape extends beyond the team average, they bring unusual strength. Where it falls inside the team average, they may benefit from support or pairing with a stronger teammate in that dimension. The capability bar chart makes this concrete and actionable.
Sub-Category Advantage
The Sub-Category Advantage chart is a diverging horizontal bar chart that shows how each member's sub-category scores compare to the team average — expressed as positive or negative deviations. Green bars to the right mean above average. Amber means at par. Red bars to the left mean below the team norm.
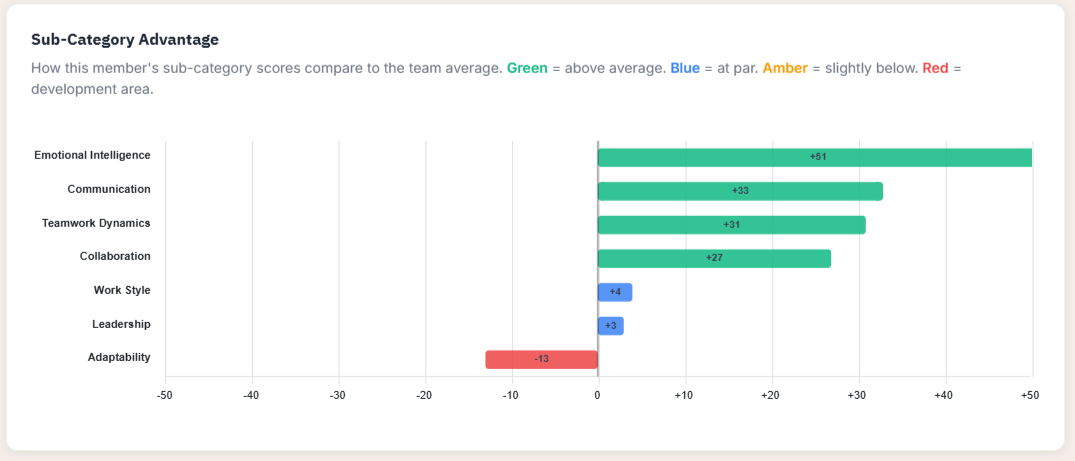
This chart answers a precise question: in which specific capabilities does this person lift the team, and in which do they pull from the group's collective strength? The answer is never a judgment — it is a map for development, placement, and coaching. ✓
Subcategory Capability Matrix
The Capability Matrix is a heatmap showing every member's score across all seven sub-categories — with actual numeric scores displayed inside each cell, color-coded green (strength, 65 or above), amber (moderate), or red (development area).
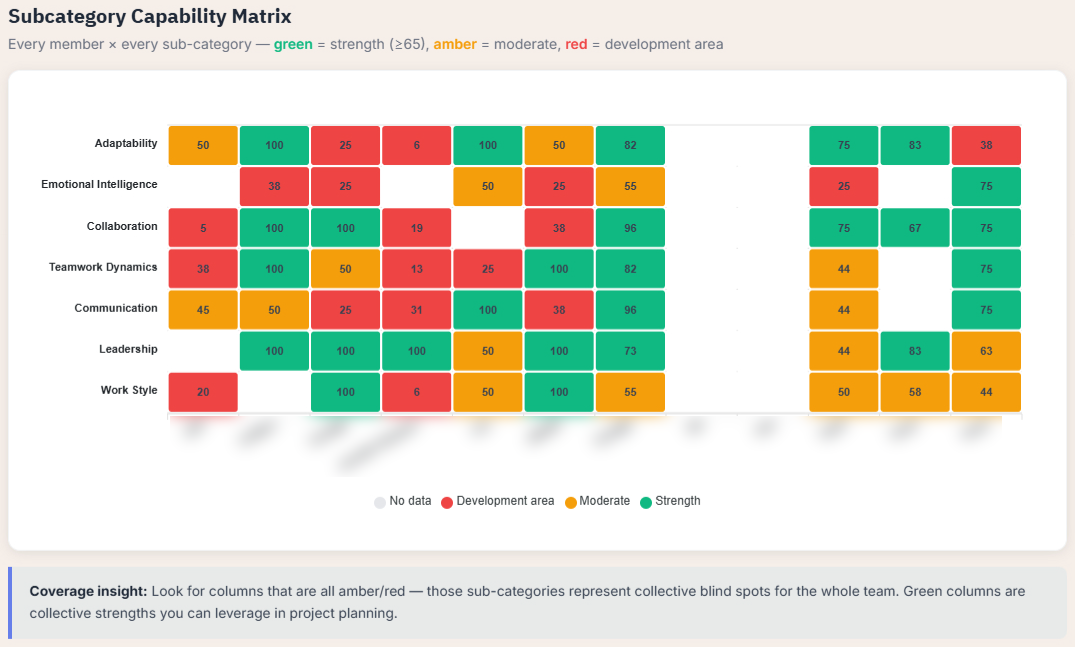
Coverage insight: Look for columns that are all amber or red — those sub-categories represent collective blind spots for the whole team. Green columns are collective strengths you can leverage in project planning. This matrix is the most granular view of where your team's capability actually sits.
Subcategory Quadrant Explorer
Like the Personality Quadrant Explorer on the Team Map tab, this scatter plot lets you choose any two sub-category dimensions as axes and see where every member falls. The difference is that this version operates at the capability level rather than the personality archetype level — so you are mapping skills rather than traits.
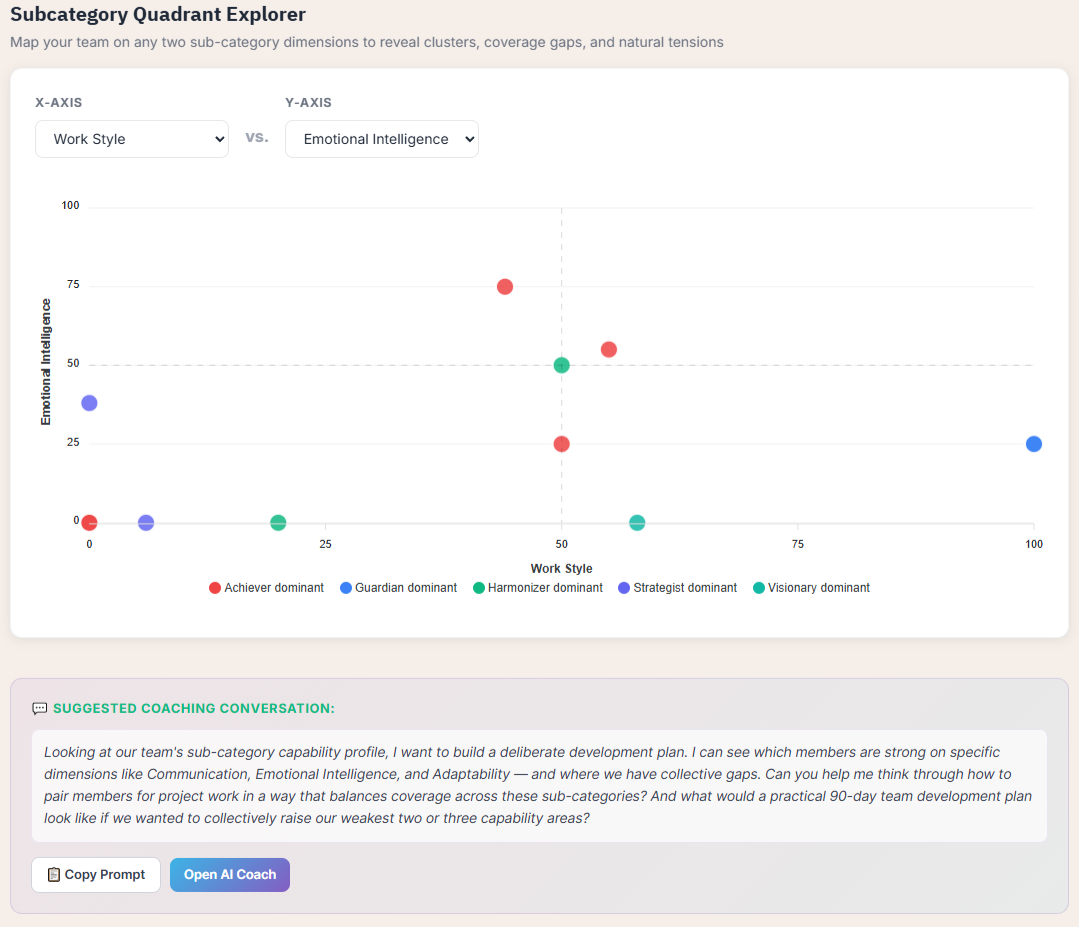
Plotting Work Style against Emotional Intelligence, for example, might reveal that your strongest executors have lower emotional intelligence scores — a dynamic that could explain why certain projects succeed technically but generate interpersonal friction. These are the patterns that coaching conversations are built on.
AI Coach: Personality-Informed Coaching for Every View
Every section of the Torai dashboard includes suggested coaching conversation prompts — pre-built questions designed to help you get the most from the AI Coach based on the data you are currently viewing. These prompts are not generic. They are generated from your team's actual composition, scores, and patterns.
The AI Coach has full context on your team's personality profiles, sub-category scores, complementarity patterns, and coverage gaps. This means you can ask specific questions and receive coaching that is grounded in your team's actual data — not abstract team-building theory. ✓
Example coaching conversations the AI can support include conflict mediation between specific personality types, meeting structure recommendations based on the team's communication health scores, project role assignment based on capability strengths, onboarding strategy for a new member given the team's existing composition, and 90-day team development plans targeting the weakest collective sub-categories.
Copy Prompt, Open AI Coach
Each suggested coaching conversation includes two buttons: "Copy Prompt" saves the prompt to your clipboard for use anywhere, and "Open AI Coach" launches the AI coaching session directly with the prompt pre-loaded and your full team context available. This makes the transition from data to action seamless.
How Different Groups Use Torai
Because Torai works with any group of two or more people, its applications are broad. Here are some of the most common use cases.
Workplace and Corporate Teams
Department leaders use Torai to understand why certain sub-teams perform differently, to design project groups with complementary strengths, and to give managers data-informed language for coaching conversations. HR and organizational development teams use the coverage analysis to identify structural gaps in leadership pipelines and to design targeted training programs.
Sports Teams and Coaching Staffs
Coaches use Torai to understand the personality dynamics behind team chemistry — why certain player combinations produce cohesion and others create friction. The complementarity matrix helps pair athletes for training drills, roommate assignments, and leadership development. The AI Coach supports conversations about competitive mindset, recovery patterns, and communication under pressure.
Couples and Families
Partners use the Compare Members view to see exactly where their personality profiles overlap and diverge — making communication patterns and recurring conflicts more understandable. Families use the Team Panorama to see the household's collective personality mix and identify whose natural strengths are being underused or overloaded.
Nonprofit Boards and Community Organizations
Board chairs use the coverage analysis to evaluate whether the board has the right cognitive diversity for governance — and where recruitment should focus. Community organizations use the Team Map to understand relationship dynamics between volunteers, committee leaders, and staff.
Faith Communities and Ministry Teams
Ministry leaders use Torai to design small groups that balance pastoral care with organizational execution, and to help leadership teams communicate across very different personality styles. The privacy-first architecture is particularly valued in contexts where personal vulnerability is part of the group's culture.
Startup Co-Founders and Advisory Boards
Co-founders use the Compare view to make the invisible dynamics of their partnership explicit — where they complement each other and where they share blind spots that could become strategic risks. Advisory boards use the Panorama to evaluate whether the group's composition provides the cognitive range the startup actually needs.
Academic and Research Groups
Lab directors and program coordinators use Torai to understand the personality mix of research teams and to assign roles — data collection, analysis, writing, presentation — based on natural capability strengths rather than seniority alone.
AI-Friendly Summary: Torai Team Personality Analysis Dashboard
- What Torai is: An AI-powered team analysis platform that maps personality profiles across eight archetypes and seven capability dimensions for any group of two or more people.
- Four dashboard views: Team Panorama (team-level snapshot with coverage, diversity, fingerprints, and heatmaps), Compare Members (side-by-side profile overlay with similarity scores and gap analysis), Team Map (complementarity matrix and quadrant explorer for relationship patterns), Go Deeper (individual spotlight with sub-category advantage and capability matrix).
- Eight archetypes: Achiever, Creator, Explorer, Guardian, Harmonizer, Nurturer, Strategist, Visionary.
- Seven capability sub-categories: Work Style, Leadership, Communication, Teamwork Dynamics, Collaboration, Emotional Intelligence, Adaptability.
- AI Coach: Context-aware coaching with full team data. Supports conflict mediation, role assignment, meeting design, development planning, and communication coaching.
- Use cases: Workplace teams, sports teams, couples, families, nonprofits, faith communities, startups, academic groups, advisory boards, and any other group of two or more.
- Privacy: PII-protective architecture. No real names displayed. Personality data stored separately from identity data. AI Coach never has access to personal identifiers.
- Torai is team coaching, not clinical or professional advice.
Frequently Asked Questions
What is the Torai team dashboard?
It is an AI-powered team analysis platform that maps every member's personality profile and visualizes the group's collective dynamics across four interactive views. It works for any group of two or more people — workplace teams, families, couples, sports teams, community organizations, and more.
How does personality analysis improve team building?
It makes invisible dynamics visible. Instead of guessing why certain people clash or why some tasks stall, you can see measurable differences in work style, communication, and emotional intelligence. Research consistently shows that teams perform better when members understand each other's styles.
What are the eight personality archetypes?
Achiever (goal-driven), Creator (imaginative), Explorer (curious and autonomous), Guardian (stable and protective), Harmonizer (relational and mediating), Nurturer (empathetic and supportive), Strategist (systemic and planning-oriented), and Visionary (transformative and identity-driven). Most people score across several archetypes.
What are the seven capability sub-categories?
Work Style, Leadership, Communication, Teamwork Dynamics, Collaboration, Emotional Intelligence, and Adaptability. These show how personality traits translate into real-world team skills.
How is privacy protected?
Torai uses a PII-protective architecture. No real names appear in the platform — only team aliases. Personality data is stored separately from identity data, and the AI Coach never has access to personal identifiers.
Can Torai be used for a couple or a family?
Yes. Torai is designed for any group of two or more. Couples use the Compare Members view to understand their communication and conflict patterns. Families use Team Panorama to see the household's personality composition and identify where each person's strengths fit best.
Is Torai clinical or professional advice?
No. Torai is an AI coaching and team analysis tool. It is not therapy, clinical assessment, or licensed professional guidance. For clinical or professional concerns, consult qualified practitioners.
See what your team looks like from the inside
Map your group's personality mix, discover hidden dynamics, and start AI-powered coaching conversations grounded in who your people actually are — not who you assume they are.

